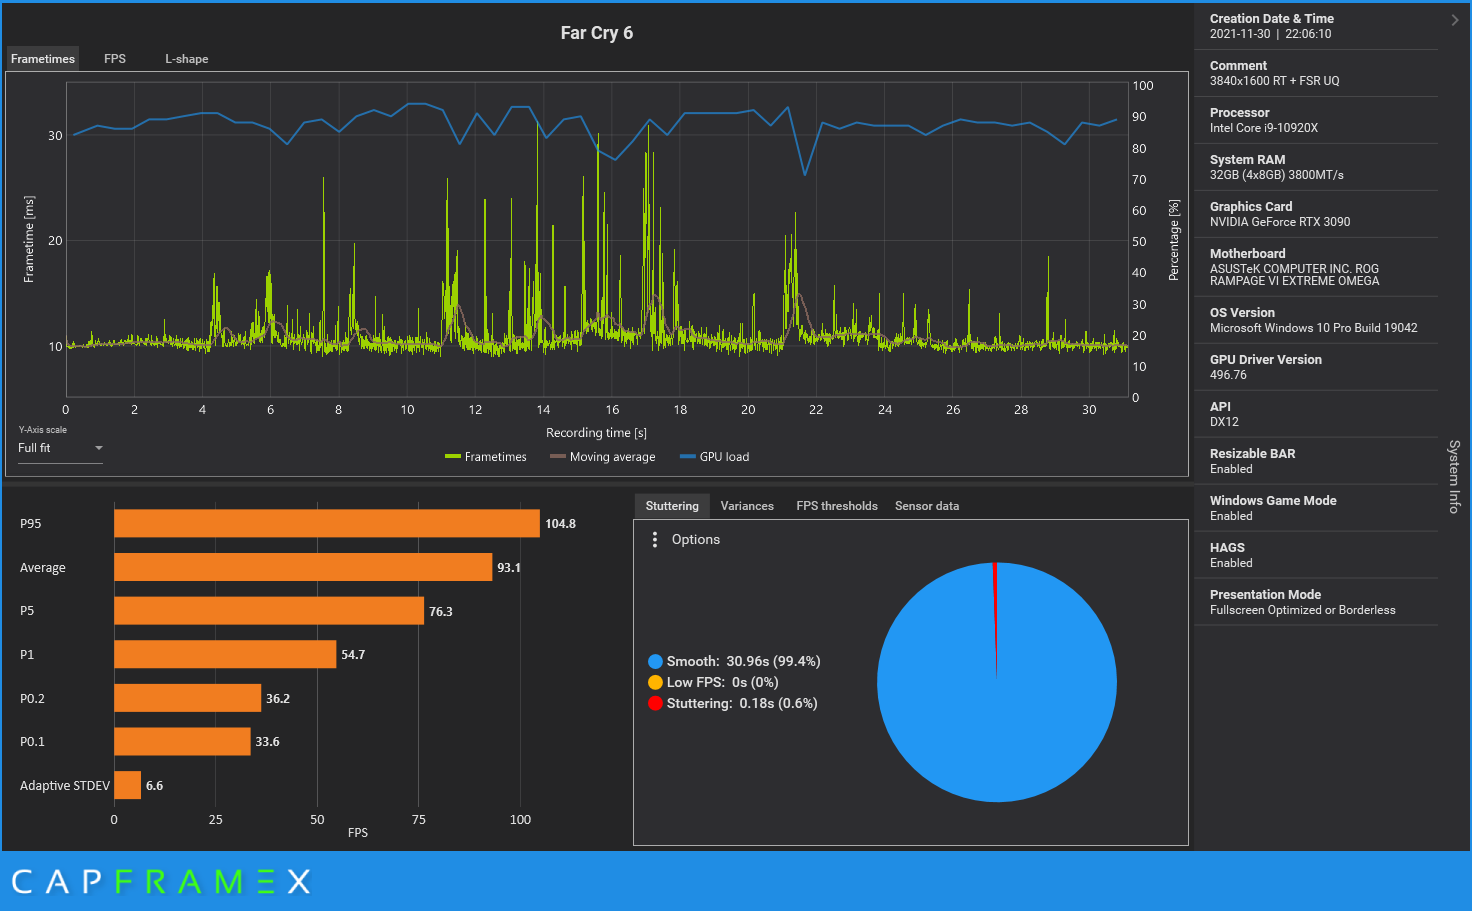
A reproducible CapFrameX workflow for measuring average FPS, 1% lows and frametimes on Windows handhelds without turning one lucky run into a preset.
Published September 2, 2026Updated September 2, 2026
Category
Performance
Difficulty
Intermediate
Reading time
10 min
Published
September 2, 2026
HandheldAtlas guide
Complete walkthrough
Introduction
A frame-rate counter can tell you what is happening at one moment. It cannot prove that a handheld preset is stable, repeatable or meaningfully better than another configuration.
CapFrameX records individual frame times through Intel PresentMon and turns those captures into comparable performance metrics. Used carefully, it can document average FPS, low-percentile performance and frame pacing for a specific game, handheld, power mode and graphics configuration.
This guide defines a practical Windows handheld workflow for HandheldAtlas contributors. It applies to devices such as ROG Ally, ROG Ally X, ROG Xbox Ally, Lenovo Legion Go and MSI Claw. It does not invent missing data: if a sensor or version cannot be verified, leave it blank.
What you need
Prepare:
A Windows 10 or Windows 11 handheld
The current CapFrameX release from the project's official GitHub page
A game with a repeatable built-in benchmark or gameplay route
Enough free storage for captures and screenshots
The original charger if the test is performed on AC power
RTSS only if you want the optional on-screen display
CapFrameX is based on Intel PresentMon. Its optional overlay is rendered through RivaTuner Statistics Server, or RTSS. The capture itself and the overlay are related but separate: an overlay screenshot is useful context, while the saved CapFrameX record is the stronger performance artifact.
Download safely
Use the download link published by the CapFrameX project or its official GitHub releases. Avoid repackaged installers from unrelated download sites.
The current project requirements include 64-bit Windows components, .NET and Microsoft Visual C++ runtime packages. Follow the requirements shown by the release you actually install rather than copying an old setup guide.
If CapFrameX behaves incorrectly after an update, the project recommends using the latest release, resetting damaged configuration files and checking for conflicting PresentMon-based monitoring processes.
Record the complete test context first
Before opening the benchmark, write down the variables that determine the result.
Handheld:
Exact manufacturer and model
Processor or APU variant
Total system memory
Fixed VRAM or UMA allocation, or Auto
BIOS or firmware version when known
Operating environment:
Windows build when known
Graphics-driver version when known
AC power or battery
Manufacturer performance mode
Manual TDP or stock power profile
Custom fan curve, if used
Background applications intentionally left running
Display and game:
Internal or external display
Resolution and refresh rate
Frame cap and V-Sync state
Game version when a known update changed performance
Graphics API, such as DirectX 11, DirectX 12 or Vulkan
Every graphics setting
Upscaler, quality mode and sharpening
Frame generation state
Dynamic resolution state
Ray tracing state
Do not publish “ROG Ally at 15W” when the actual test was performed on an Ally X, a different APU or a vendor profile whose real power limit is unknown. The exact device and power configuration are part of the benchmark.
Prepare a repeatable scene
A built-in benchmark is usually the easiest route to reproduce because the camera path and workload are controlled by the game. It is not automatically representative of every gameplay area, so describe it honestly as a built-in benchmark.
When no suitable benchmark exists, create a repeatable gameplay route:
1Load the same save.
2Start from the same location.
3Use the same camera direction and movement path.
4Avoid random combat where possible.
5Include a demanding area rather than an empty room.
6Define a clear start and stop point.
7Record the approximate route duration.
Open-world traffic, weather, NPC behaviour and online matches introduce variation. If those elements cannot be controlled, state that limitation instead of pretending the run is perfectly deterministic.
Stabilize the handheld
Connect or disconnect the charger according to the intended test and do not change power source between runs.
Apply the final TDP, fan, VRAM, display and graphics settings. Restart the game when a setting requires it. Let shader compilation and initial asset loading finish before recording.
Run the scene once as a warm-up. A warm-up reduces the chance that first-load shader work, launcher activity or cold asset caching dominates the measured run.
Close downloads, update tools, browsers and monitoring utilities that are not part of the test. CapFrameX warns that overlapping PresentMon-based FPS or frametime monitoring from tools such as HWiNFO or AIDA64 can conflict with its capture service. Sensor monitoring can remain useful, but avoid running two competing frametime capture paths.
Configure CapFrameX
Open the Capture section and confirm that CapFrameX detects the correct game process. If several candidate processes appear, select the game process rather than the launcher.
Set a capture hotkey that does not overlap with the game, handheld command center or overlay controls. Choose a fixed capture duration when the route has a predictable length, or use the same manual start and stop points for every run.
Keep the capture configuration unchanged across the comparison.
The optional RTSS overlay can show FPS, frame time, temperatures, clocks, power and other available sensors. CapFrameX states that its overlay uses RTSS and that sensor availability depends on the hardware and monitoring library. A missing handheld sensor must remain missing; do not substitute an unrelated package-power value and label it total system power.
Capture the baseline
Use this sequence:
1Load the prepared save or benchmark.
2Wait until loading and shader activity have settled.
3Move to the exact start point.
4Start the CapFrameX capture.
5Perform the defined route without opening menus or changing settings.
6Stop at the defined endpoint.
7Add a useful comment to the record.
8Let the handheld return to a comparable temperature before the next run.
For a normal comparison, capture at least three valid runs of the same route. A 60- to 120-second gameplay route is a practical starting point, but a longer route may be necessary for streaming-heavy or open-world games. Consistency matters more than chasing a universal duration.
Discard a run only for a documented reason, such as an incoming update, accidental menu pause, route mistake or unrelated background interruption. Do not discard a slow run merely because it makes the preset look worse.
Change one variable at a time
To test the effect of a setting, keep everything else fixed.
Examples:
15W versus 20W at identical graphics settings
1080p versus 720p with the same upscaler disabled
FSR Quality versus Balanced at the same output resolution
Low versus Medium shadows with the same route
Frame generation off versus on, recorded as separate profiles
Changing resolution, TDP, graphics preset and frame generation together can show that one complete profile is faster, but it cannot prove which change produced the difference.
Understand the metrics
Average FPS
Average FPS summarizes the complete capture. It is useful, but it can hide short stalls and uneven delivery.
Frametime
Frametime is the interval between frames, measured in milliseconds. CapFrameX explains that FPS is derived from these measured intervals: FPS equals 1000 divided by frametime. A flat frametime graph indicates more consistent delivery; spikes represent individual long frames.
1st-percentile FPS
CapFrameX calls the FPS value below which one percent of rendered frames fall P1. It is more stable than a single minimum frame and is useful for hardware comparisons.
1% low
“1% low” does not have one universal calculation across every tool. CapFrameX offers both 1% low average and 1% low integral methods. The project describes the integral method as time-based and the average method as the average of the lowest one percent of values.
Always record which CapFrameX metric you used. Do not mix P1, 1% low average and 1% low integral under one unlabeled field.
HandheldAtlas accepts a measured 1% low only when the source or capture identifies the calculation. If only P1 is available, label it as P1 rather than silently renaming it.
Frametime graph and threshold view
Inspect the graph, not only the summary cards. Repeated spikes at the same place may reveal traversal or shader problems. One isolated spike can be an external interruption.
CapFrameX also provides threshold analysis showing time spent below chosen performance levels. This can reveal a bad section that an average obscures.
Compare the runs
Check:
Whether all runs used the same duration and route
How tightly average FPS values agree
Whether low-percentile metrics repeat
Whether frametime spikes occur in the same location
Whether temperatures or clocks drift as the device warms
Whether one run is a legitimate outlier
CapFrameX can aggregate run history from raw frame times rather than merely averaging summary values. Aggregation is useful when the run set is valid and consistent. It does not rescue mismatched routes or settings.
If performance falls across consecutive runs while temperature rises, report the warm-state behaviour instead of selecting the first, coolest result.
What evidence to retain
A publishable HandheldAtlas preset should retain:
The CapFrameX capture or exported result
A CapFrameX analysis screenshot with its branding
The exact test route or built-in benchmark name
Run count and capture duration
Average FPS and the clearly named low metric
Frametime evidence
Exact handheld, TDP, resolution and graphics settings
Test date
Game, driver and OS versions when verified
Temperature, power and battery fields only when the sensors and measurement method are known
The CapFrameX project specifically encourages reviewers to use its built-in screenshot function because it adds the tool name and logo. That helps future readers identify where the graph came from.
An OSD screenshot alone may confirm settings and instantaneous output, but it does not prove an average FPS or 1% low. Use it as supporting evidence, not as a replacement for the capture.
Common mistakes
Publishing one lucky run
One run can be affected by temperature, background work or random game behaviour. Repeat the same route and report the representative result.
Calling instantaneous FPS an average
The number visible in an overlay at one moment is not the average of a recorded test.
Mixing 1% low definitions
P1, 1% low average and 1% low integral are different metrics. Name the exact one used.
Testing a different scene after changing settings
A comparison is meaningless when the workload changes with the configuration.
Ignoring warm-up and thermal state
The first run after launch and a heat-soaked third run may not represent the same operating condition.
Forgetting frame generation
Generated frames can increase displayed FPS while the base rendered frame rate and input response remain different. Record the technology and mode explicitly.
Stacking capture tools
Two tools using PresentMon-based frametime monitoring can conflict. Keep one authoritative capture path.
Estimating missing values
Never infer TDP, 1% low, temperature, driver version or battery life from a nearby test. Blank is more honest than a polished fiction.
A HandheldAtlas-ready checklist
Before submitting a preset, confirm:
Exact handheld and APU are identified
AC or battery state is recorded
TDP or stock power profile is known
VRAM allocation is known or blank
Resolution, refresh rate and cap are recorded
Every graphics and upscaling setting is included
Frame generation is explicitly on or off
Route or built-in benchmark is named
Capture duration and run count are recorded
Average FPS comes from CapFrameX
The low metric is named precisely
Frametime evidence is retained
Screenshot or capture URL opens the actual proof
Unknown fields remain blank
Test date is recorded
The practical standard
A useful handheld benchmark is not the highest number you can produce. It is a result another owner can reproduce.
Lock the hardware, power mode, resolution and complete graphics configuration. Warm the game, capture the same route at least three times, inspect frametimes and name the exact low metric. Preserve the original evidence and document every limitation.
That turns “it runs great” into a preset the community can test, verify and maintain.
Official sources
CapFrameX official website
https://www.capframex.com/
CapFrameX GitHub repository, releases, requirements and troubleshooting
https://github.com/CXWorld/CapFrameX
CapFrameX: Explanation of different performance metrics
https://www.capframex.com/blog/post/Explanation%20of%20different%20performance%20metrics
CapFrameX: The challenge of displaying performance metrics as FPS
https://www.capframex.com/blog/post/The%20challenge%20of%20displaying%20performance%20metrics%20as%20FPS
CapFrameX: Configure the RTSS game overlay
https://www.capframex.com/blog/post/How%20to%20configure%20the%20CapFrameX%20game%20overlay
CapFrameX support and capture troubleshooting
https://www.capframex.com/support