Big-screen Ryzen performance with a 65Wh battery.
Presets
0
Benchmarks
7
Tested games
3
Resolutions
3
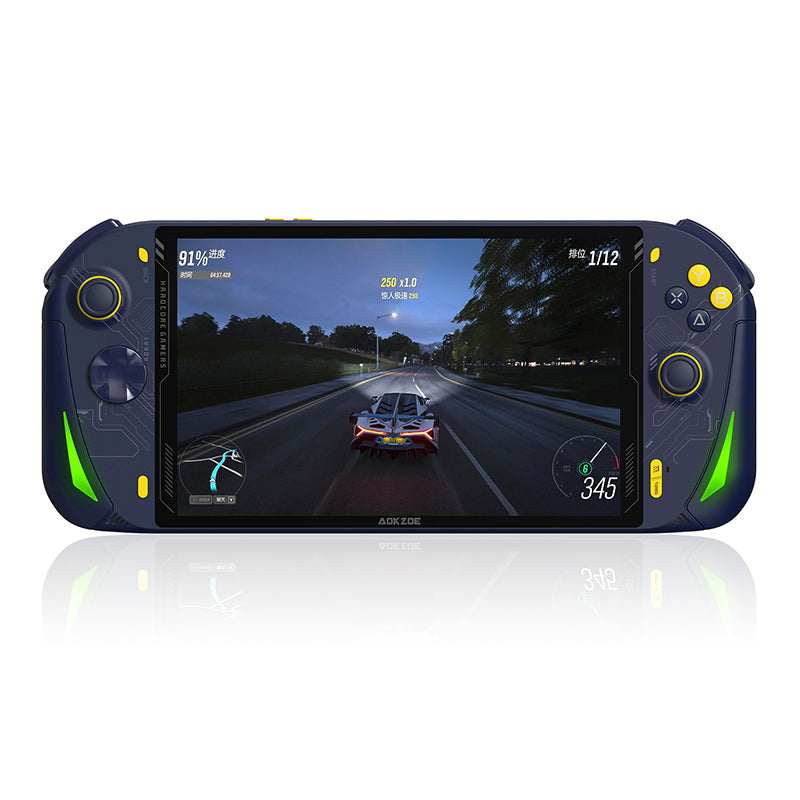
Operating system
Windows 11 Home
Processor
AMD Ryzen 7 7840U
Memory
32GB / 64GB LPDDR5X-7500
Display
8" IPS
Battery
65Wh
Weight
≈729g
Hardware
Operating system
Windows 11 Home
Processor
AMD Ryzen 7 7840U
Memory
32GB / 64GB LPDDR5X-7500
Storage
M.2 2280 PCIe 4.0 SSD
Display size
8" IPS
Resolution
1920 × 1200
Refresh rate
60 Hz
Battery
65Wh
Weight
≈729g
Atlas data
Tested games
3
Resolutions
3
Published presets
0
Published benchmarks
7
Device profile
Performance data and presets shown below are loaded directly from the live HandheldAtlas database.
Game settings
Performance data
Average FPS
20.05
See the test notes for reported graphics settings.
Test date not reported · Added to Atlas Sep 8, 2026
Test route: Street Fighter 6 benchmark — Fighting Ground
SCENE: Fighting Ground. This is one scenario of the Street Fighter 6 benchmark, not an average across all three scenarios. Historical review published 2023-07-20. Device: AOKZOE A1 Pro, Ryzen 7 7840U. Settings: 1920 × 1080, highest graphics settings, 28W comparison test. Upscaling, render scale, cap, individual graphics options and VRAM allocation are not separately disclosed. Evidence: Street Fighter 6 comparison chart in the linked review; matching Fighting Ground bar, 20.05 FPS. Benchmark scenario result, not an instantaneous overlay reading. DROIX cautioned that these launch-era manufacturer drivers made comparisons provisional. This does not represent current driver performance. Exact test date, driver version, capture duration, run count, lows and a battery run tied to this scenario are unavailable. Source checking is not a retest.
Source checked Sep 8, 2026. Checking a source is not a new performance test.
Average FPS
37.4
See the test notes for reported graphics settings.
Test date not reported · Added to Atlas Sep 8, 2026
Test route: Street Fighter 6 benchmark — Battle Hub
SCENE: Battle Hub. This is one scenario of the Street Fighter 6 benchmark, not an average across all three scenarios. Historical review published 2023-07-20. Device: AOKZOE A1 Pro, Ryzen 7 7840U. Settings: 1920 × 1080, highest graphics settings, 28W comparison test. Upscaling, render scale, cap, individual graphics options and VRAM allocation are not separately disclosed. Evidence: Street Fighter 6 comparison chart in the linked review; matching Battle Hub bar, 37.4 FPS. Benchmark scenario result, not an instantaneous overlay reading. DROIX cautioned that these launch-era manufacturer drivers made comparisons provisional. This does not represent current driver performance. Exact test date, driver version, capture duration, run count, lows and a battery run tied to this scenario are unavailable. Source checking is not a retest.
Average FPS
32.75
See the test notes for reported graphics settings.
Test date not reported · Added to Atlas Sep 8, 2026
Test route: Street Fighter 6 benchmark — World Tour
SCENE: World Tour. This is one scenario of the Street Fighter 6 benchmark, not an average across all three scenarios. Historical review published 2023-07-20. Device: AOKZOE A1 Pro, Ryzen 7 7840U. Settings: 1920 × 1080, highest graphics settings, 28W comparison test. Upscaling, render scale, cap, individual graphics options and VRAM allocation are not separately disclosed. Evidence: Street Fighter 6 comparison chart in the linked review; matching World Tour bar, 32.75 FPS. Benchmark scenario result, not an instantaneous overlay reading. DROIX cautioned that these launch-era manufacturer drivers made comparisons provisional. This does not represent current driver performance. Exact test date, driver version, capture duration, run count, lows and a battery run tied to this scenario are unavailable. Source checking is not a retest.
Average FPS
68
See the test notes for reported graphics settings.
Test date not reported · Added to Atlas Sep 8, 2026
Historical launch-era test, review published 2023-07-20. AOKZOE A1 Pro, Ryzen 7 7840U; not the older A1 or A1X. Manufacturer-supplied graphics drivers; the reviewer explicitly treats these early results as provisional comparisons. Settings: lowest graphics quality as specified by the reviewer, 1920 × 1200, 28W. The source does not specify the game's edition. Evidence: Shadow of the Tomb Raider benchmark comparison chart in the linked review; 68 FPS in the matching device row. FPS is the publisher's built-in benchmark result, not a gameplay target or instantaneous overlay. 1%/0.1% lows and battery life are not supplied. VRAM allocation, precise test day, software builds, capture duration and run count are unavailable. Upscaling, frame-generation and cap overrides are not separately documented; do not interpret this as a verified native-rendering comparison. Named graphics profile only, not a complete custom preset.
Average FPS
84.83
See the test notes for reported graphics settings.
Test date not reported · Added to Atlas Sep 8, 2026
Historical launch-era test, review published 2023-07-20. AOKZOE A1 Pro, Ryzen 7 7840U; not the older A1 or A1X. Manufacturer-supplied graphics drivers; the reviewer explicitly treats these early results as provisional comparisons. Settings: lowest graphics quality as specified by the reviewer, 1280 × 800, 28W. Evidence: Cyberpunk 2077 benchmark comparison chart in the linked review; 84.83 FPS in the matching device row. FPS is the publisher's built-in benchmark result, not a gameplay target or instantaneous overlay. 1%/0.1% lows and battery life are not supplied. VRAM allocation, precise test day, software builds, capture duration and run count are unavailable. Upscaling, frame-generation and cap overrides are not separately documented; do not interpret this as a verified native-rendering comparison. Named graphics profile only, not a complete custom preset.
Average FPS
88
See the test notes for reported graphics settings.
Test date not reported · Added to Atlas Sep 8, 2026
Historical launch-era test, review published 2023-07-20. AOKZOE A1 Pro, Ryzen 7 7840U; not the older A1 or A1X. Manufacturer-supplied graphics drivers; the reviewer explicitly treats these early results as provisional comparisons. Settings: lowest graphics quality as specified by the reviewer, 1280 × 800, 28W. The source does not specify the game's edition. Evidence: Shadow of the Tomb Raider benchmark comparison chart in the linked review; 88 FPS in the matching device row. FPS is the publisher's built-in benchmark result, not a gameplay target or instantaneous overlay. 1%/0.1% lows and battery life are not supplied. VRAM allocation, precise test day, software builds, capture duration and run count are unavailable. Upscaling, frame-generation and cap overrides are not separately documented; do not interpret this as a verified native-rendering comparison. Named graphics profile only, not a complete custom preset.
Source checked Sep 8, 2026. Checking a source is not a new performance test.